


How Measures works
One process, supported by my own software.
Measures is my own margin process. I designed it after running my own food factory, and built my own software to support it. It starts from your accounting package and is agreed back to your sales-ledger totals.
It isn't me and a spreadsheet. And you deal with me, the person doing the work, from the first chat to the handover.
The margin report in 2 minutes
How every product is built, layer by layer, then what the report shows you, on Churchdale, our demo company.
Every product built from how it is really made, then the four types of margin.
2 minutes · demo report, dummy dataSix steps, the same for every client
- 1
Check the data
A free half-day look at what you've got: your accounting package, spreadsheets, recipes and stock.
- 2
Clean and link it
Sales, recipes, stock, payroll and customers joined up in my software. Every figure traces back to an invoice.
- 3
Cost every line
On site with a stopwatch, scales and a notebook, for the costs nobody writes down. Then every product, customer and job costed.
- 4
Tie it to your accounts
Agreed back to your sales-ledger totals, with any differences listed, so your accountant can follow every number.
- 5
Find the margin, together
My software uses AI to sift the data across the four types of margin. Each idea gets a low-to-high range and its assumptions. You know your people, so we choose where to start together.
- 6
Keep it live
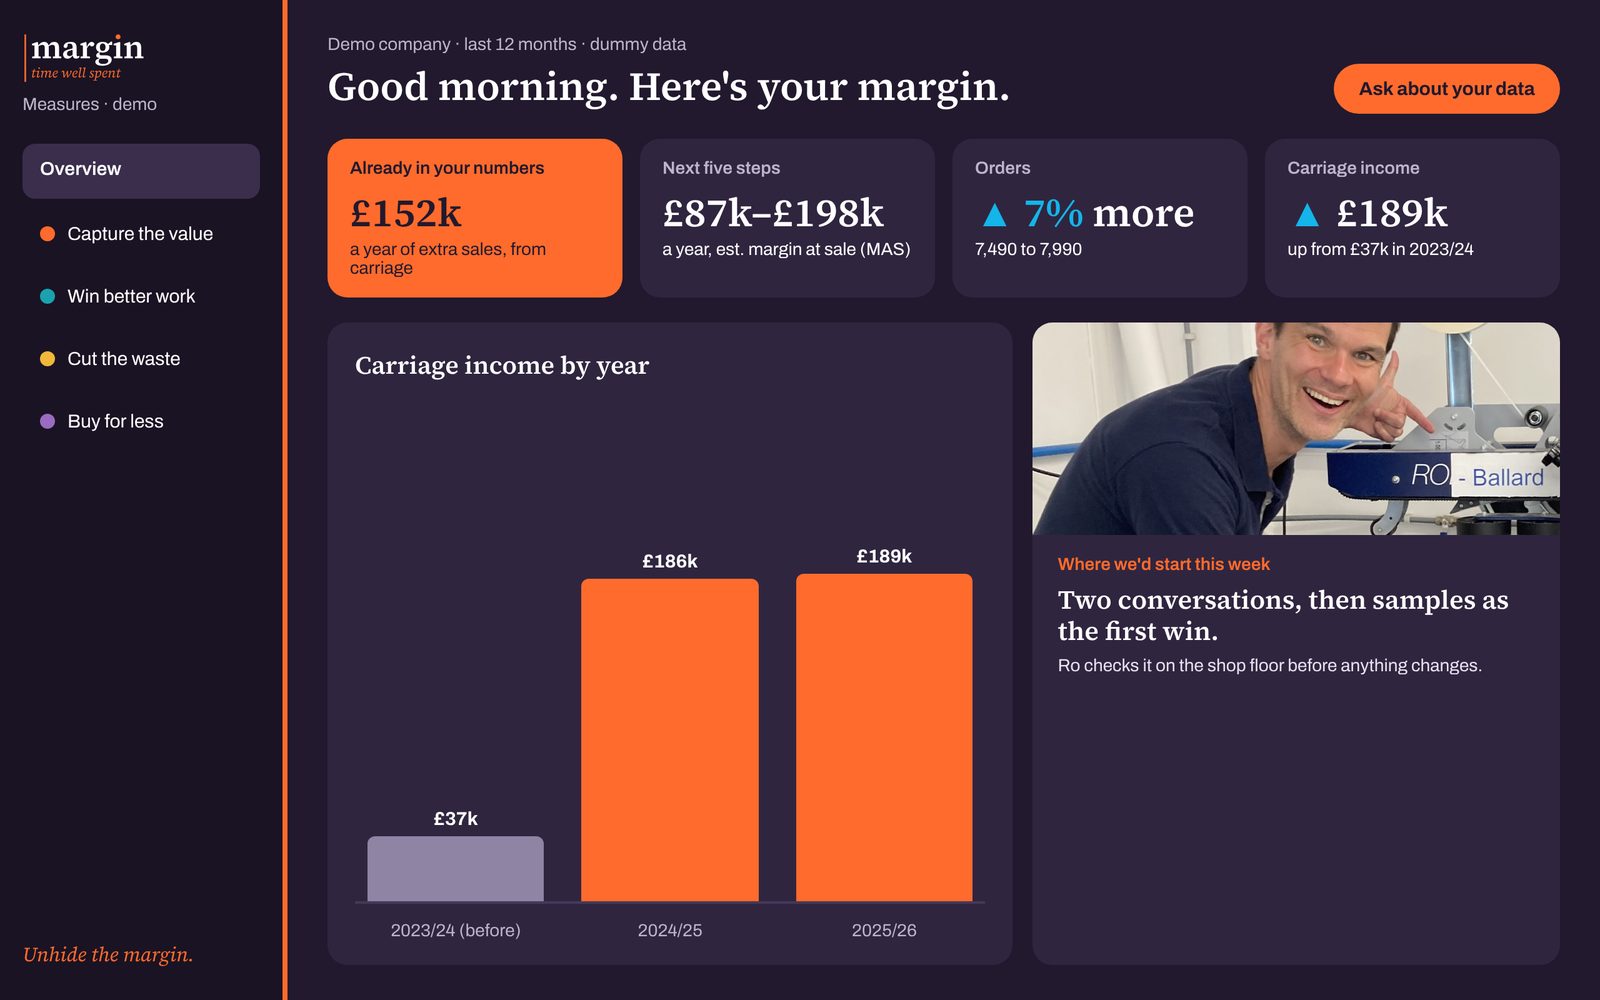
A clickable dashboard your team keeps using after I hand over.
Every £100 of sales, slice by slice
Each cost takes its slice, down to margin at production, at dispatch and at sale.
Example figures.
37 seconds · example figuresDown to the point of sale
Every margin figure in Measures names its level. I quote margin at production first, with margin at sale beside it, so you see both the recipe and what the order really leaves you.
Cost to serve = dispatch + office + sales team
Yours to keep
- A margin report your accountant can follow, with every assumption written down as a number
- A clickable dashboard your team keeps using
- Your data cleaned, linked and tied to your accounts
- A short list of where to start, each with a low-to-high range
Easy to follow
Every figure ties back to your sales ledger, and every report says which margin it shows. It isn't profit, cash or audited accounts, and it says so, so your accountant can follow every number.

Fancy a chat about your margin?
Half an hour on a call. Tell me about your business, test me as hard as you like, and I'll tell you where I'd look first.